Fans of cricket may be delighted that The Ashes has arrived, hot on the heels of the month-and-a half-long festival of cricket that was the World Cup. For those who are less keen, The Ashes is an historic battle for cricketing superiority between England and Australia; I should also point out that England in this case refers to the men’s team and consists of players representing the England and Wales Cricket Board. In fact, the England women’s team has already been battling the Australians in the weeks leading up to the men’s version of the competition – to far less fanfare, friction, and financial recompense. Hopes of success for the men in The Ashes are high after the England men’s team recently and amazingly won the World Cup (anyone who has followed cricket over the last 30 years will have some sense of how ridiculous this is). And the ridiculousness continued through to the final ball of the tied final game, which was eventually decided by considering which team had managed to hit the ball beyond the boundary of the pitch more frequently over the course of the day’s play, perhaps the equivalent of the Isner-Mahut 72-68 tiebreak anomaly during Wimbledon 2010. Extreme cases like this are always exciting, and touch on the sweet spot between maths and sport that allow us to consider the implications of mere numbers in new and fascinating ways.
Cricket aficionados like myself are attracted to the sport’s plethora of statistics like magpies chasing shiny objects. Run rate, strike rate, and batting or bowling averages are just a few of the stats enjoyed by fans and commentators alike. There is an excessive reverence for a good statistic; for example, Englishman Alastair Cook (294), Australian Michael Clarke (329) and New Zealander Brendan McCullum (302) all achieved these highest career scores against India after Indian player Ishant Sharma had dropped a catch early on in each of their respective innings.
This reverence for a stat may be due to the nature of cricket, perhaps best characterised by long periods of quiet (which some lesser minds may describe erroneously as ‘boring’) punctuated by intense periods of incredible skill, tension, excitement and sporting extravagance. Perhaps the regular lulls in the action require a talking point – and there’s only so many times a commentator can remark on pigeons in the outfield. Alternatively, it may simply be due to the fact that cricket is a game built on numbers: 6 balls in an over; 50 overs per team in the match; 6 runs for clearing the boundary… it’s inevitable that someone, somewhere might start thinking creatively and begin to draw some graphs.
The risk of hosting a World Cup during the British summer I’m sure is immediately obvious. ‘Rain stopped play’ is a depressingly common event in domestic matches – in fact there were more games lost due to rain by the end of the second week of the 2019 World Cup than had been lost across the whole of any individual previous tournament. So what happens in this statistics-obsessed sport when the rain affects a match? In the case of the weather being so bad that no cricket is played, it’s nice and simple: as teams get 2 points for a win, 1 for a draw and none for a loss, if a game is completely abandoned due to bad weather, it’s treated as a draw and both teams receive 1 point. But what if it rains during the game, causing one team to lose some, but not all, of their allotted 50 overs (an over is a series of 6 balls bowled by the opposing team)?
Wonderfully, the result is calculated by the use of mathematical modelling, by which I mean that a model is used to create a new, adjusted target number of runs which the team batting second needs to score to try and win the match.
At this point it’s probably worth pausing for a cricket refresher: two teams of 11 players take turns to ‘bat’ and to ‘bowl’; these turns are called an ‘innings’ in which the batting team tries to score as many runs (points) as possible, while the bowling team tries to take 10 opposition ‘wickets’ by getting 10 players out to end the innings early and keep the score as low as possible. In an innings, the bowling team bowls a maximum of 300 balls, split into 50 ‘overs’ of 6 balls each. The team that bats first sets a target score, and the team batting second then must score 1 more run than the target to win the match.
So back to models: early models used in professional cricket were based on average run rate, so if the batting team was scoring at say 4 runs per over, and they lost 10 overs due to the rain, 40 runs would be added to their total and compared to the opposition score. This is a simple model to use but clearly quite crude as teams tends to score at different rates depending on how many players are still available to bat, for example. A more sophisticated model was developed that attended to ‘most productive overs’ but this memorably resulted with the unusual situation in 1992 of South Africa needing 22 runs from 13 balls to win against England in their semi-final when the rain started. 12 minutes later when the rain stopped, the ‘most productive overs’ method mandated that South Africa now needed 21 runs from a single remaining ball. The South African players could be forgiven for feeling somewhat aggrieved – particularly as the usual maximum score possible from a single ball is just six!
This situation resulted in the birth of the fabled Duckworth-Lewis method – not the rather enjoyable cricket themed popular beat combo from Divine Comedy frontman Neil Hannon, but a mathematical model for cricket scores developed by two statisticians (and more importantly cricket fans) Frank Duckworth and Tony Lewis.
This more sophisticated model is based on the assumption that each team has a set of resources available at the beginning of a game, 300 balls and 10 wickets in hand, and the amount of this resource remaining varies exponentially as overs are completed.
Image source: https://en.wikipedia.org/wiki/Duckworth%E2%80%93Lewis%E2%80%93Stern_method#/media/File:DuckworthLewisEng.png
For example, let’s say that Team 1 batted their full 50 overs and scored 312 runs. If the rain started after 30 overs of the second innings (leaving 20 overs remaining) and the batting team had 5 players left to bat, Duckworth-Lewis predicts that they have used 60% of their resources. In order to calculate the target to win, simply find 60% of team 1’s score or 312 x 0.6 = 187.2 (which gets rounded up to 188). So if team 2 had scored 188 runs or more by the time the game was called off, they would be awarded the win.
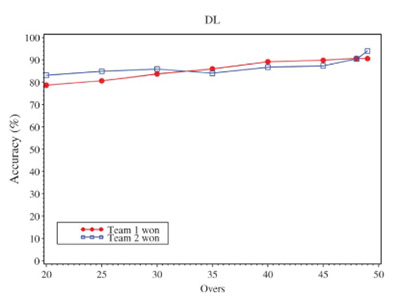
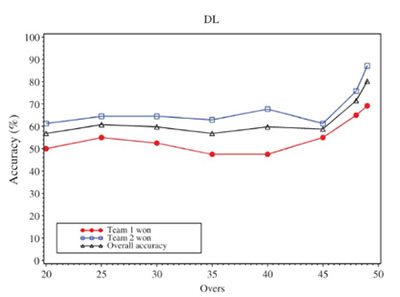
If, as often happens, both teams lose overs, resource calculations are made for each team and a relative proportion calculated but the basic principle remains the same. As with all models, this one is not perfect and depends heavily on the assumption that the relationship between resources is exponential. Comparing against historic matches it does stand up pretty well, and hence Duckworth-Lewis was adopted in the mid-90s as the official method for determining rain-affected results. However, there are certain circumstances where the model breaks down. For example, the number of overs lost affects the accuracy of the model, as investigated by Schall and Weatherall (2013) who compared the distribution of outcomes from dry cricket matches and rain-affected matches calculated using Duckworth-Lewis, hypothesising that if the method was fair this should be the same. The graph below suggests that the accuracy steadily improves as the game approaches 50 overs; the second graph applied the method to matches that were deemed to be closely contested, highlighting that in specific cases the model may not be quite so robust.


More recently, the method has been refined to become the Duckworth-Lewis-Stern method to attempt to take into account how scoring rates change late on in an innings in modern cricket.
References:
Schall, R., & Weatherall, D. (2013). Accuracy and fairness of rain rules for interrupted one-day cricket matches. Journal of Applied Statistics, 40(11), 2462-2479.
Join the conversation: You can tweet us @CambridgeMaths or comment below.