If you made it this far - well done! You now know all the code you need to create a simulation that records each individual dice roll in a frequency table.
Now is a good time to think about the logic of our macro. Each time we press our button, we want the macro to generate a number between 1 and 6, then add one to the appropriate frequency. The simplest approach is to read all the current frequencies from the spread sheet, add 1 to the appropriate frequency, then write all the frequencies back to the spread sheet. This is not very efficient, but it is straightforward to code and the computer has so much processing power it will barely break a sweat despite doing lots of redundant things.
The first thing to do is to read the current values from the frequency table. Try to interpret the code below before reading the paragraph explaining it.
For i = 0 to 5
Results(i) = Cells(6, i + 2).Value
Next i
By now you should be able to roughly work out what is going on. For each pass through the loop, the computer will look in Cell (6, i+2), read the value, and store it in a drawer of the array. When i is two for example, the computer looks in cell (6,4), reads the number which is there, and then stores it in Results(2) the third drawer in the array. If the cell is empty, the computer will store a value of 0.
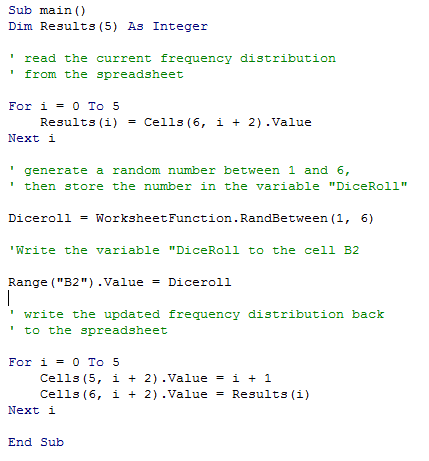
Type in the code so that the complete macro looks like this:

You will probably notice two things at this point. Firstly, the line highlighted in yellow has been secretly added: this line generates the second row of the frequency table, by writing the values in Results() back to the spreadsheet. The second thing you will notice is that if you run the code, you will generate a new value on the die each time you press the button, but the table does not update. We haven't yet told the computer to put the result from each roll into the Results array. To do this we need one final line:
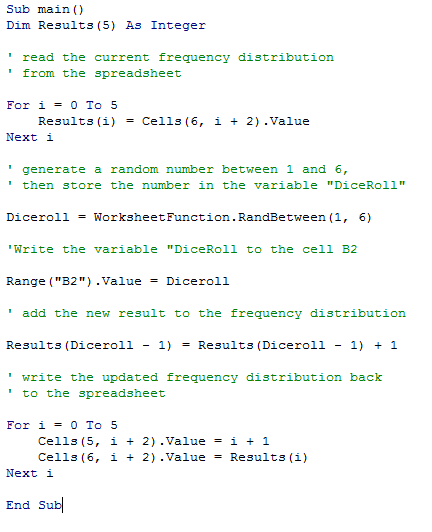
Results(Diceroll - 1) = Results(Diceroll - 1) + 1
This is a common trick if you want to change an existing value. If we roll a 5, for example, the computer is told to take the value in Results(4), add one to it, then store this new value in Results(4) - overwriting the value that was originally there. The final code looks like this.

Congratulations! You made it through to the end and now have a useable simulation and can close the macro editor. As before you can format your spreadsheet and make the frequency table stand out. Highlight the frequencies and insert a graph in the usual way. Each time you roll the dice the frequency table will update and so will the graph. For a reminder of how to set up a button to control the macro, you can read part 1 here.
At the moment, in order to reset the simulation you will need to manually delete the frequencies from the table. You now know enough to create a new macro to reset the spreadsheet automatically and assign it to a new button. See if you can figure out how before I explain in the next blog.