Events of recent years, coupled with the platform of social media to share them widely, have brought into stark view systemic inequalities and biases throughout every strata of society. #MeToo began to expose the extent of misogynistic entitlement; COVID-19 has made plain the extent of widespread inequality and poverty; and alongside these, recent events in the US and closer to home have concentrated attention on the racial inequalities and violence at the heart of too many people’s lived experience.
Of course, “brought into stark view” is something of a misnomer: for me, as a straight white male, I acknowledge that this is spoken from within the societal jackpot that is the intersection point of the Venn diagram of privilege. I see these issues almost always as an outsider, never quite understanding in the same way as someone who cannot dip in and out of these issues but who has no choice about confronting them daily. Many teachers reading this will themselves identify with these injustices as part of their own personal history, and many will be teaching in communities that have been worn down, held back, or disempowered by societal and organisational structures.
It’s often uncomfortable to acknowledge the existence of privilege, demanding as it does an acknowledgement that one’s own success and comfort is in a very real way contingent on the repression or exploitation of others. That this is done invisibly, at arm’s length, and by a system that we as individuals can have little direct control over, does not absolve us of responsibility. Once we have done the work to recognise the existence of our own particular set of privileges, the realisation can be disempowering, overwhelming even: how can we be agents of change? How can we be allies and stand alongside our LGBTQ+ students, our BIPOC students, our female students? How does all this intersect with being a teacher, an educator, or an academic, in organisations that often frown on being “too political” – that is, simply bringing this discrimination into the visible spectrum?
One thing I have been thinking about: as teachers of statistics we have a golden opportunity to take advantage of our subject to help support change. Recommendations from research suggest that one of the most effective ways to support the development of statistical skills is to move teaching away from focusing on executing techniques to calculate statistics from tiny, invented data sets, and to focus instead on using real data as a context for answering questions which require statistical techniques. Statistical questions should be meaningful, and are never neutral. Once one has accepted that, it is clear that moving away from “How many siblings do we have in our class?” and towards “Which languages do we speak in our class?” is an inherently loaded step, bringing with it important issues such as cultural capital, nationalism, racism, xenophobia and socio-economic status. To collect data and to use it has always been about much more than numbers, and it’s time we acknowledged this more openly. Why not ask questions which are philosophical, ethical, powerful or uncomfortable? On top of this, an important weapon for confronting bias is to shine a light on that bias through the use of robust data; creating a situation where one either has to acknowledge the bias or deny the data itself. Data can be powerful: the more expert we become in handling it, the greater the size of the “black box” we create. This box may well be filled with dynamite at times; a well-designed infographic can be explosive:
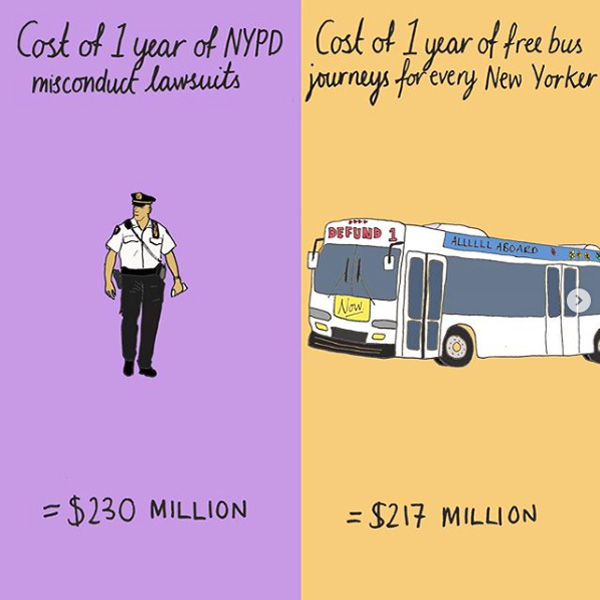
Image source: Mona Chalabi
Worries about using data in this way are only natural. But, if you have checked that your data sources are sound, there is nothing untoward here: this is not an exercise in telling pupils what to think, or recruiting them to partisan politics. It is about exploring data honestly and openly, and considering its ramifications in context. Pupils will need space to explore their feelings about the data and what it means, and that’s ok. It’s not about getting a right answer, even if we’re still in mathematics class.
So where to source the data from? Sources such as the World Bank, national governments (e.g. data.gov.uk), and the World Inequality Database provide datasets that may be a good starting place for students to explore a particular issue. On top of this sites like Gapminder and ProCivicStat host curated databases and online exploratory tools that make the process of analysis straightforward, while data journalists such as Mona Chalabi create beautiful data visualisations focused on highlighting big societal issues.
It’s easy to think that the challenge is too big – that societal forces, vested interests and ingrained power structures will overwhelm any individual act. But every single such action is a ripple in the pond, and if we choose our data sets well then every statistics lesson can also be a chance to help our students feel seen; an opportunity to let our students see something from a fresh perspective; and a reminder to ourselves that there will always be more to do, and that we have some agency to do it. After all, what does data teach us? That scaling up can be powerful, and also that single arbitrary points can tip things (and indeed, this is inherent in the very nature of tipping). An individual act is never enough, but multiplied by many, we may be able to shift our centre of mass in the right direction.
Join the conversation: You can tweet us @CambridgeMaths or comment below.